Strong data comparison: 21 % more yield through targeted shading optimization
Shading is one of the most common causes of yield losses in photovoltaic systems. In east-west systems in particular, local obstacles such as chimneys, roof structures or dormers can affect individual modules and reduce the output of an entire string. This customer's system showed exactly that scenario on the west side of the roof. By retrofitting six BRC Power Optimizers M600-E, the shading was clearly defused and the energy yield noticeably increased.
The initial situation
The system runs on an Axitec AXIhycon 20H inverter with three strings.
Inverter
- Axitec AXIhycon 20H
- 3 MPPT / 3 strings
String 1 – east orientation
- 11 × Axitec GL WB AC-450TGBL/108WB
- No optimizers installed
String 2 – west orientation
- 20 × Axitec GL WB AC-450TGBL/108WB
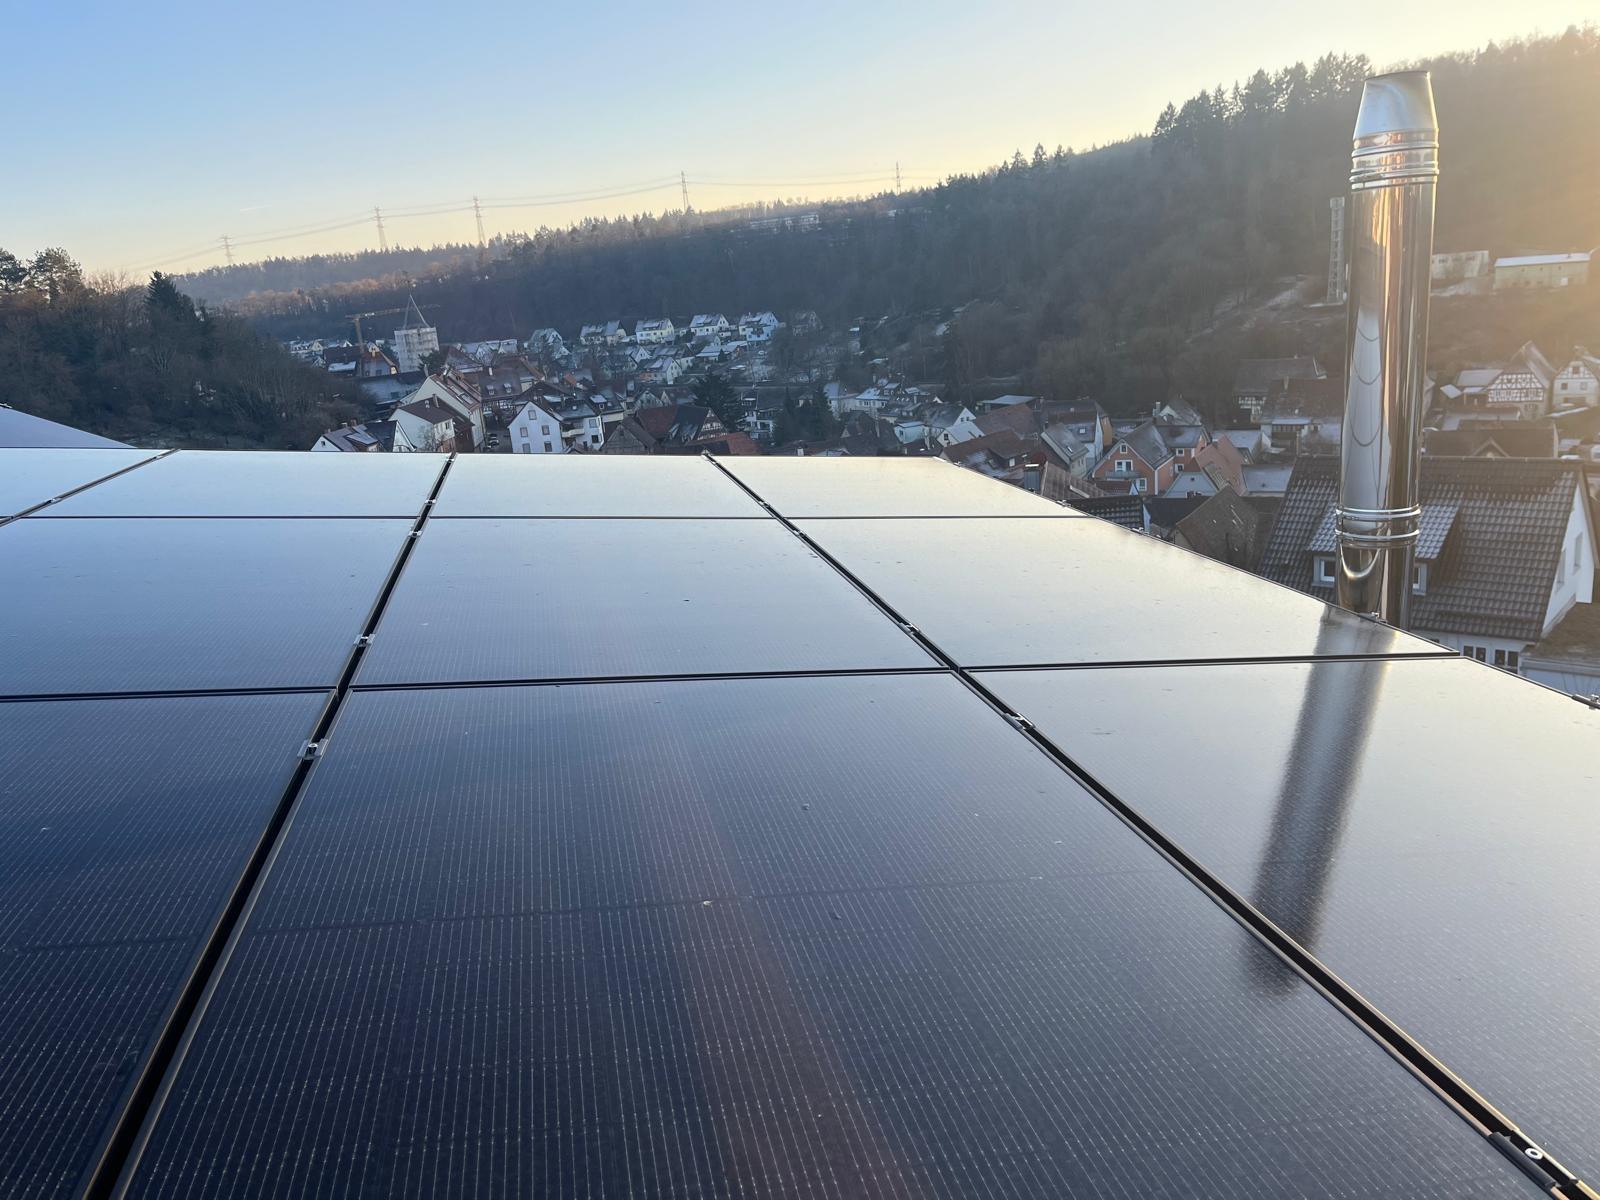
- Partial shading from a chimney, see photo
- The 6 shaded modules retrofitted with Power Optimizers M600-E
The east side of the system worked reliably and without irregularities from the start. On the west-facing string, however, shading from a chimney caused performance losses, particularly in strong sunlight.
The optimization measure
To reduce the effects of the shading, six BRC Power Optimizers M600-E were installed on the affected modules on 7 March 2026. The aim was to bring the output of the shaded modules up to the level of the unshaded ones. This prevents individual affected modules from limiting the performance of the entire string and reducing the energy yield.
The data comparison
Two days with comparable conditions were selected for a meaningful assessment:
- 5 March 2026 – before the retrofit
- 12 March 2026 – after the retrofit
Both days offered maximum solar irradiation, which makes the effects of the optimization particularly easy to compare.
Daily yield compared
- Without optimizers22.93 kWh
- With optimizers27.68 kWh
- Additional yield+4.75 kWh
- Yield increase+21 %
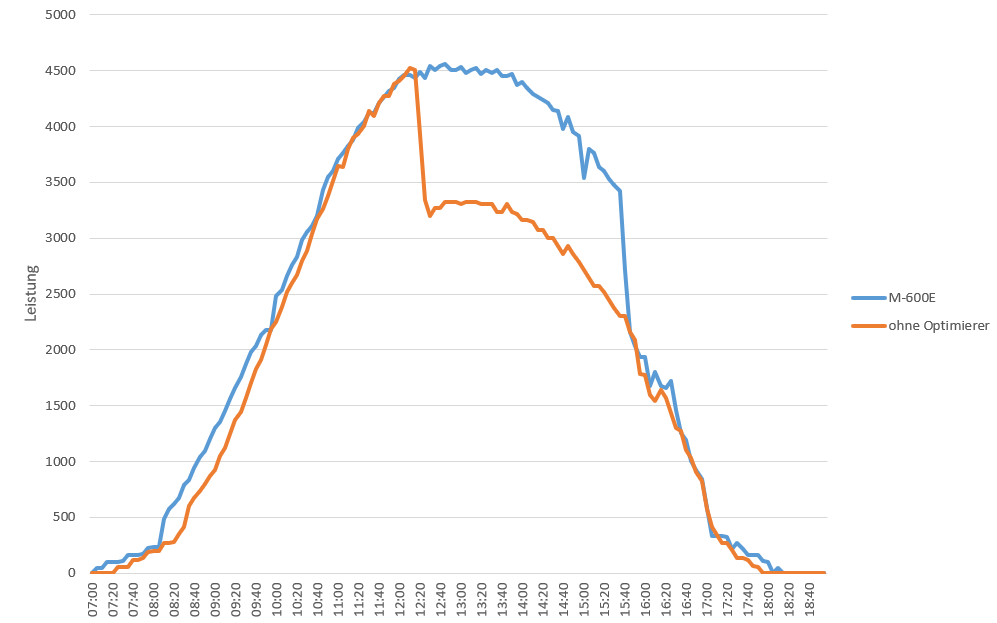
Retrofitting the optimizers produced an additional daily yield of 4.75 kWh. That equals a yield increase of 21 % compared with the reference day without optimization.
What does the performance curve show?
The recorded chart puts the yield curves of both days side by side. The orange curve represents operation without optimizers, the blue curve operation with Power Optimizers M600-E. Before the optimization, the shading from the chimney visibly limited how much power the system could deliver; after the optimizers were installed, it makes far better use of the available irradiation. The higher blue curve illustrates the additional yield achieved by the measure.
In the periods when the chimney casts a shadow on individual modules, the remaining modules in the string benefit from being decoupled by the optimizers. This stabilizes the overall string output and raises the daily yield.
Conclusion
This practical example shows how much even local shading can affect the energy yield of a PV system, and how effectively those losses can be reduced through targeted optimization.
By retrofitting just six BRC Power Optimizers M600-E, the operator gained 4.75 kWh, or 21 %, in additional yield on a sunny reference day.
A strong result that makes one thing clear: even a small number of well-placed optimizers can contribute considerably to the yield of shaded systems.